Posts about JavaScript
-
Website for Learning Phonics
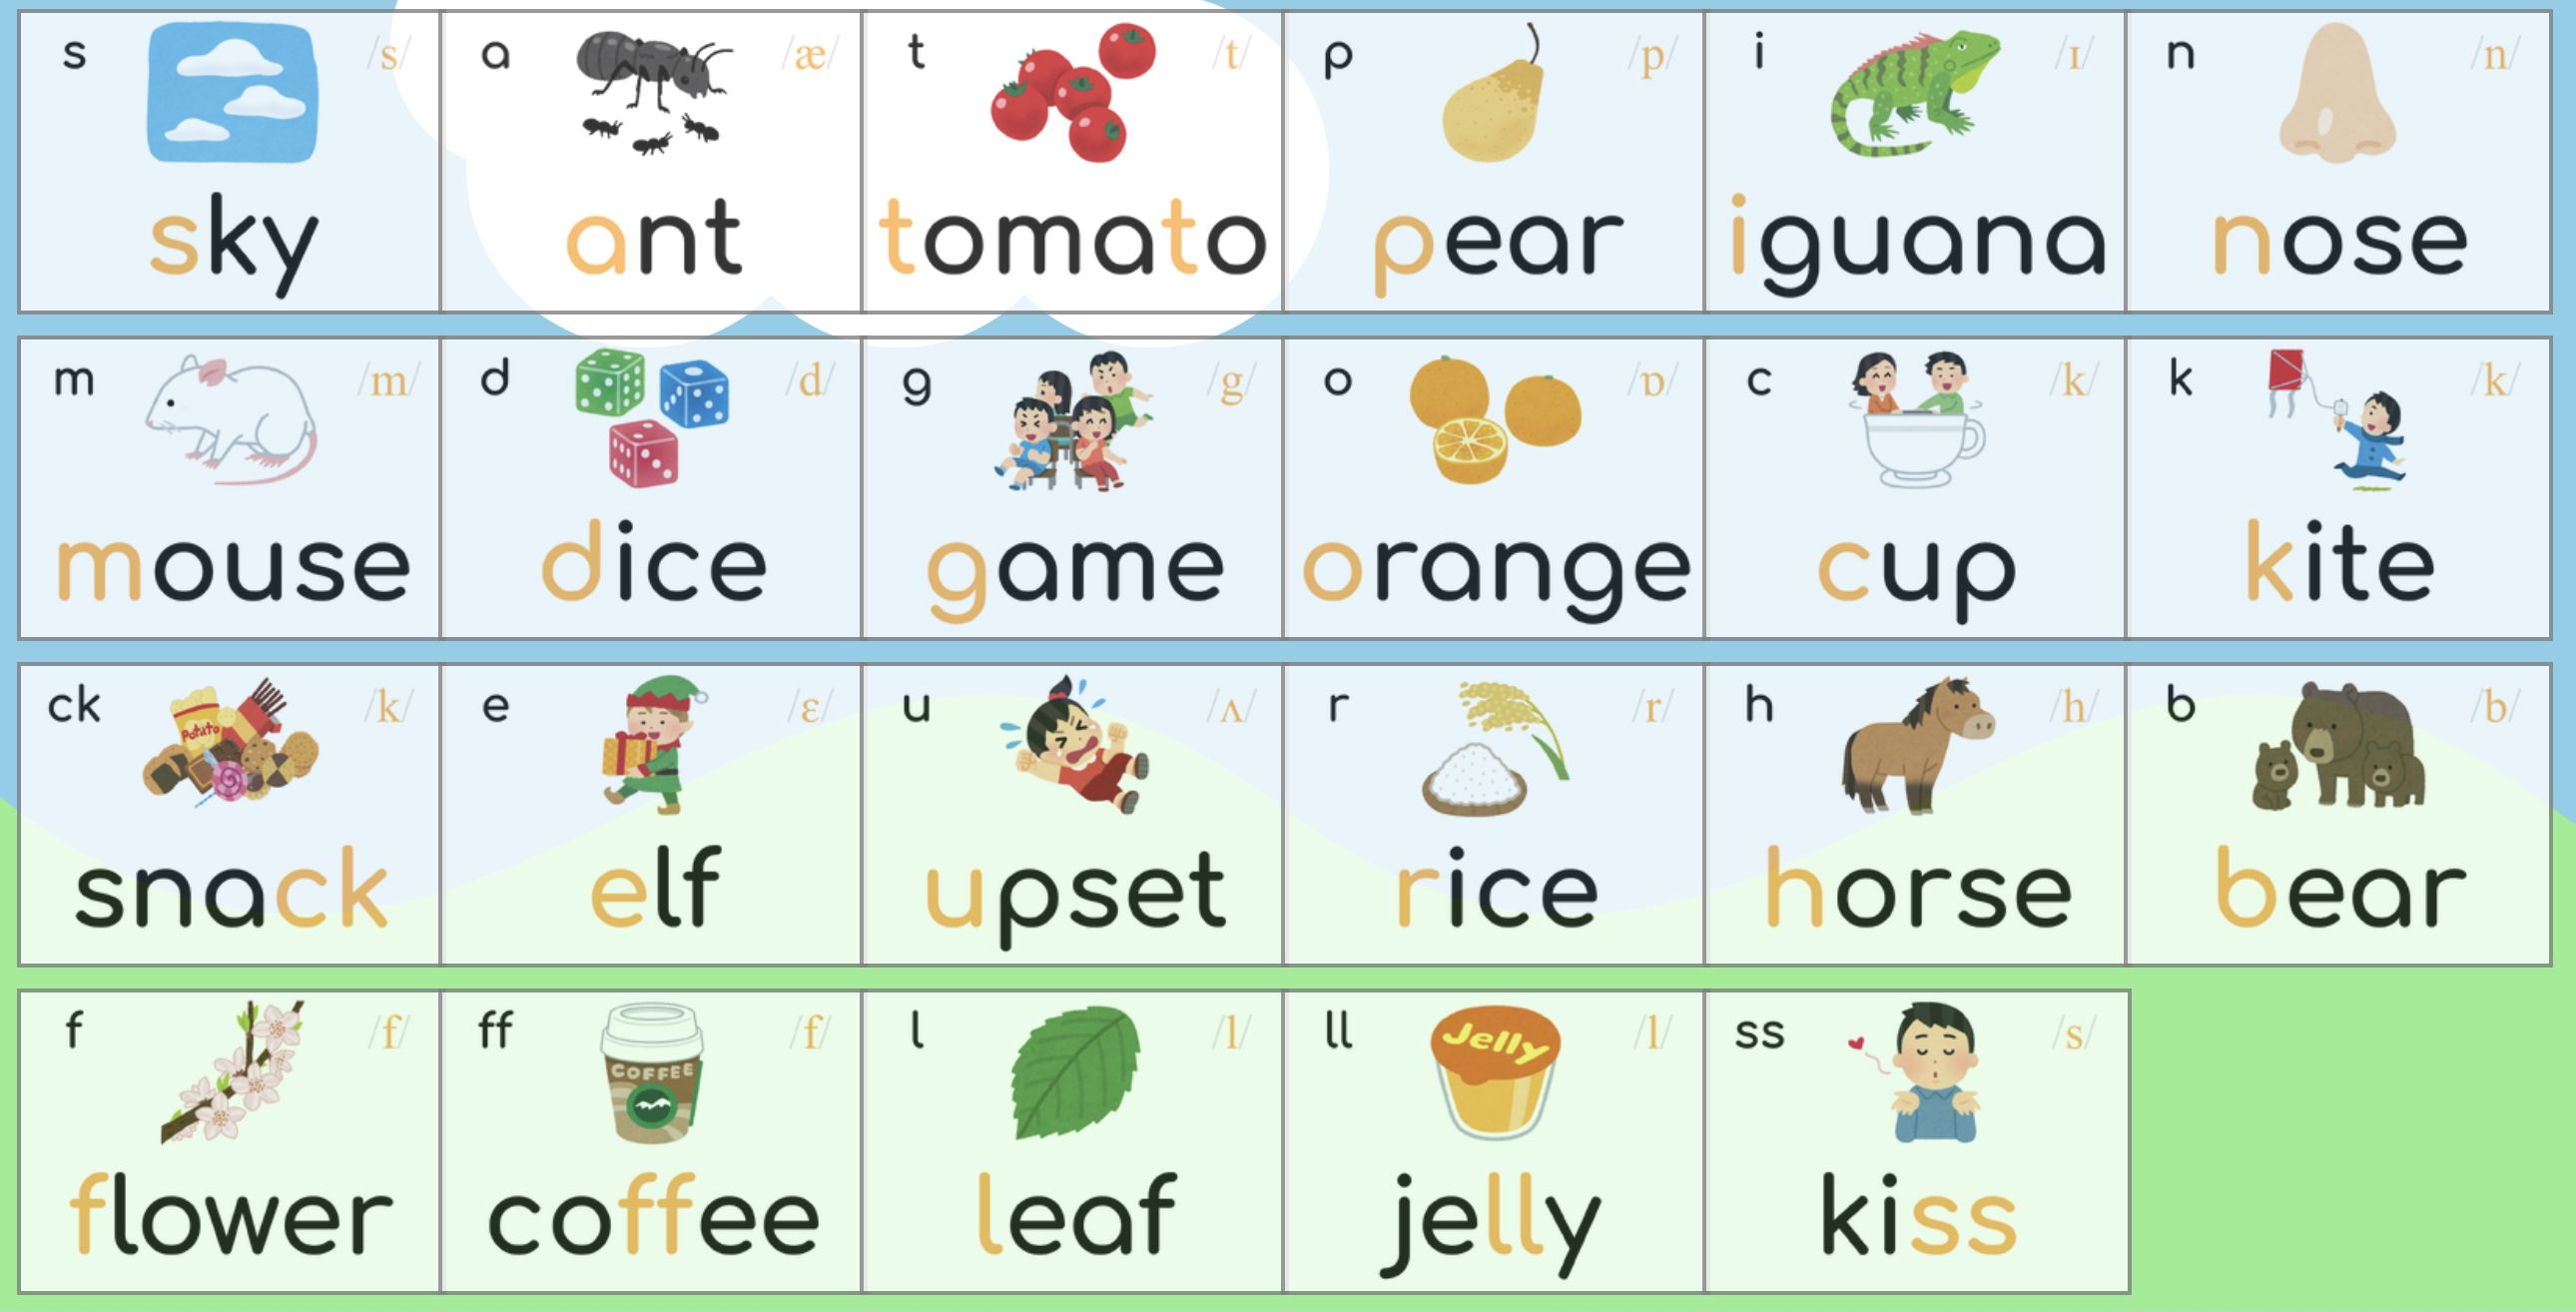
Lots of the kids in my class have trouble learning phonics, and for good reason! It’s not an easy skill to learn, and can be difficult to practice without someone on hand to correct pronunciation. Meanwhile learning phonics is (as far as I know) the best way to learn how to read which is (as far as I know) one of the most fulfilling things a person can do with their day.
To help my students practice at home, I made a website where they can click on a phoneme and listen to the pronunciation.
Additionally, added a quiz mode that will play a sound, and allow them to click on the corresponding card.
Continue reading...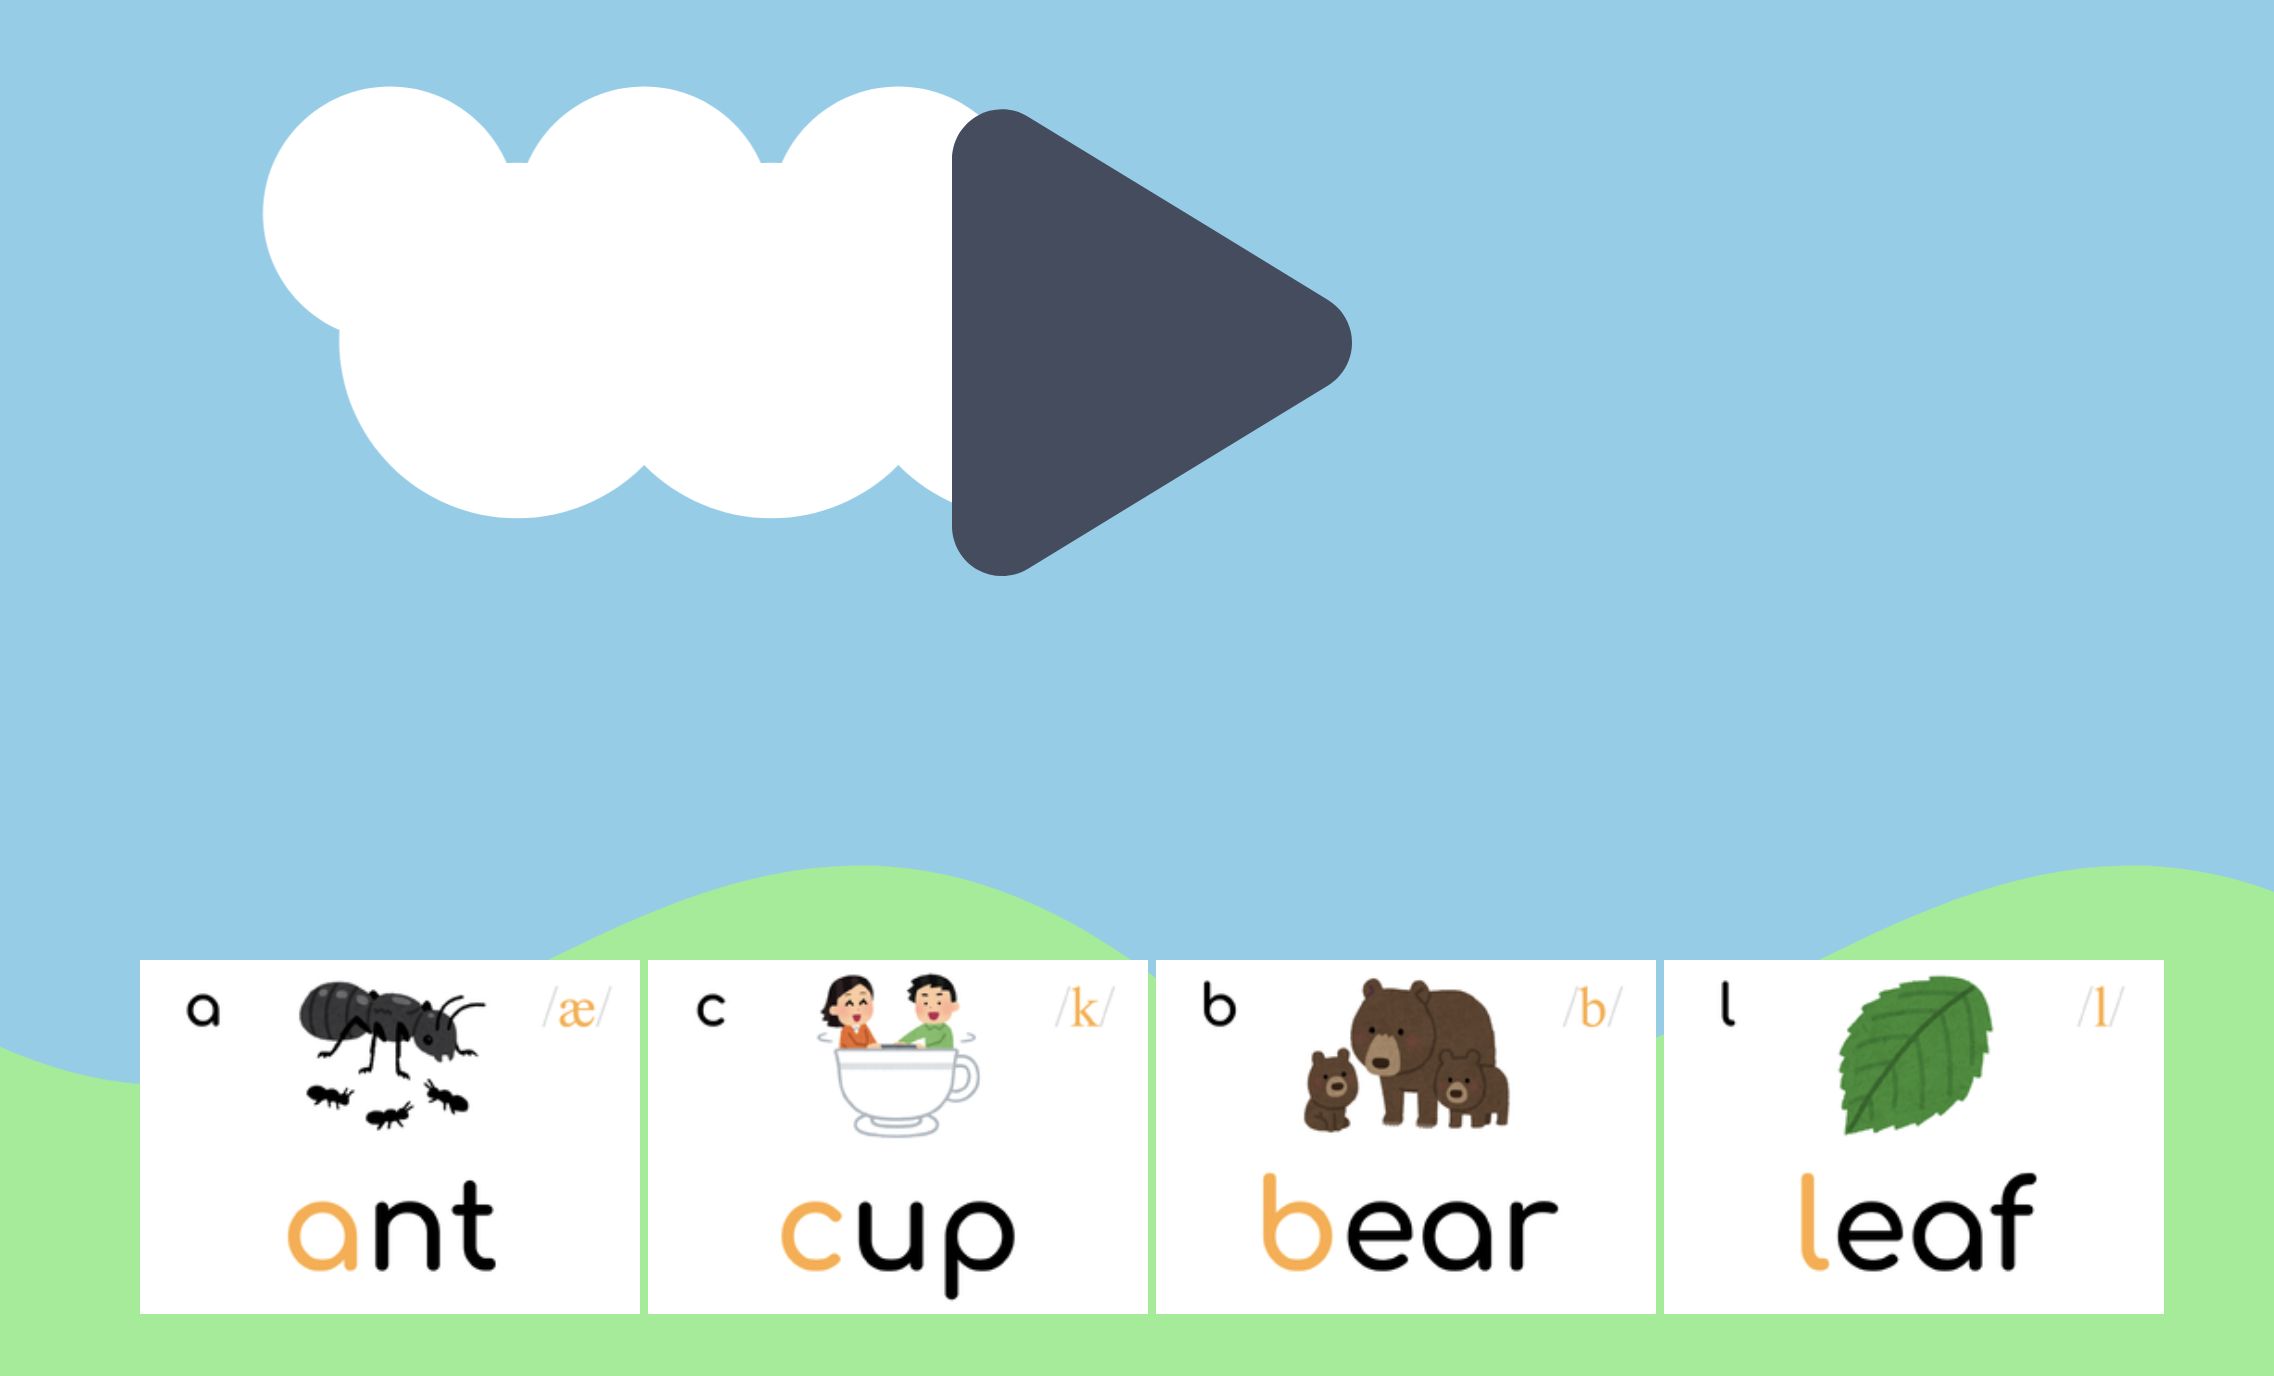
-
Web Scraper to Avoid Crowds

My neighborhood is a great place to live. A great place, that is, until a concert or baseball game finishes at Kyocera Dome and the streets, restaurants, and grocery stores are flooded by rivers of people.
In an attempt to combat this issue, I wrote a Google Apps Script that will scrape the Kyocera Dome monthly schedule and create google calendar events for each event. At least this way I can try to avoid going to the supermarket when I know it’s going to be a problem.
I’ve definitely done more useful things with programming, but this was deeply, deeply satisfying. If, for some reason, you also have a problem with Kyocera Dome and want to subscribe to the calendar, you can find it here.
If you happen to live near an arena and want to write your own version, you can find the code on my github.
Continue reading... -
Map For The Modern Mann Podcast
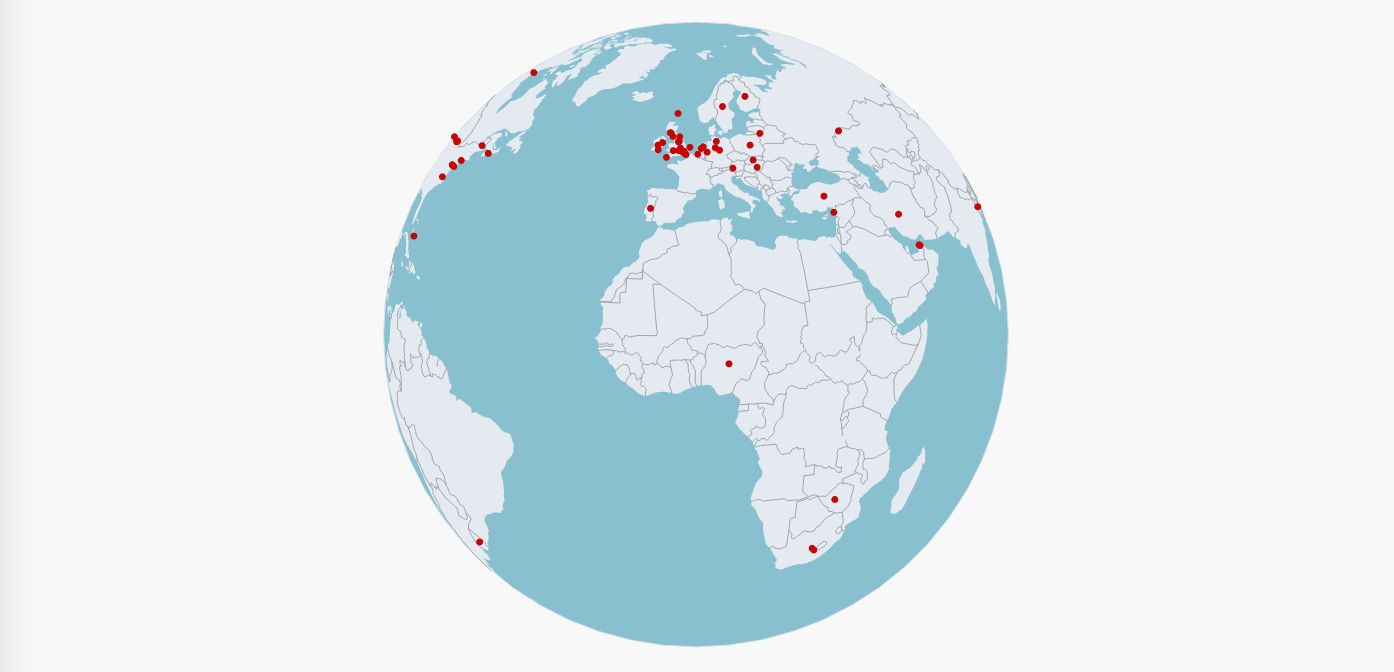
One of the podcasts I listen to, The Modern Mann, features honorary “Mannbassadors”, patrons of the show who represent their various locales. I made an interactive 3D map of all the Mannbassadors over the years, written in D3.JS.
As I was working on the project, the host, Ollie Mann, mentioned that he was looking for a map. My map was one of several submissions, and was ultimately chosen to be featured on his site.
You can see the full map on the podcast's website or here
Continue reading... -
Sea Level Rise in Japan
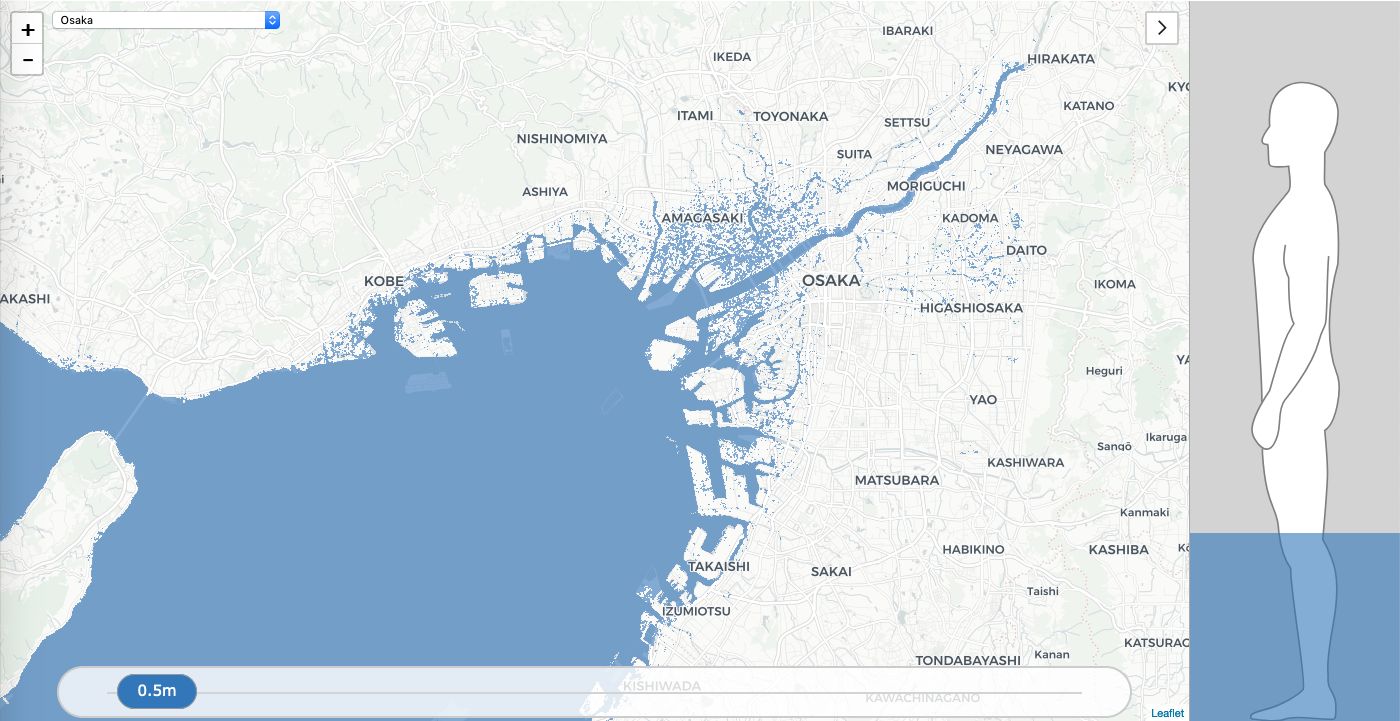
In 2018, I wanted to create a long-form infographic similar to those found online and in magazines. At the same time, I wanted to refresh my knowledge of HTML, CSS, and Javascript, which I hadn’t used since college, and learn how to create interactive web maps and graphs using R.
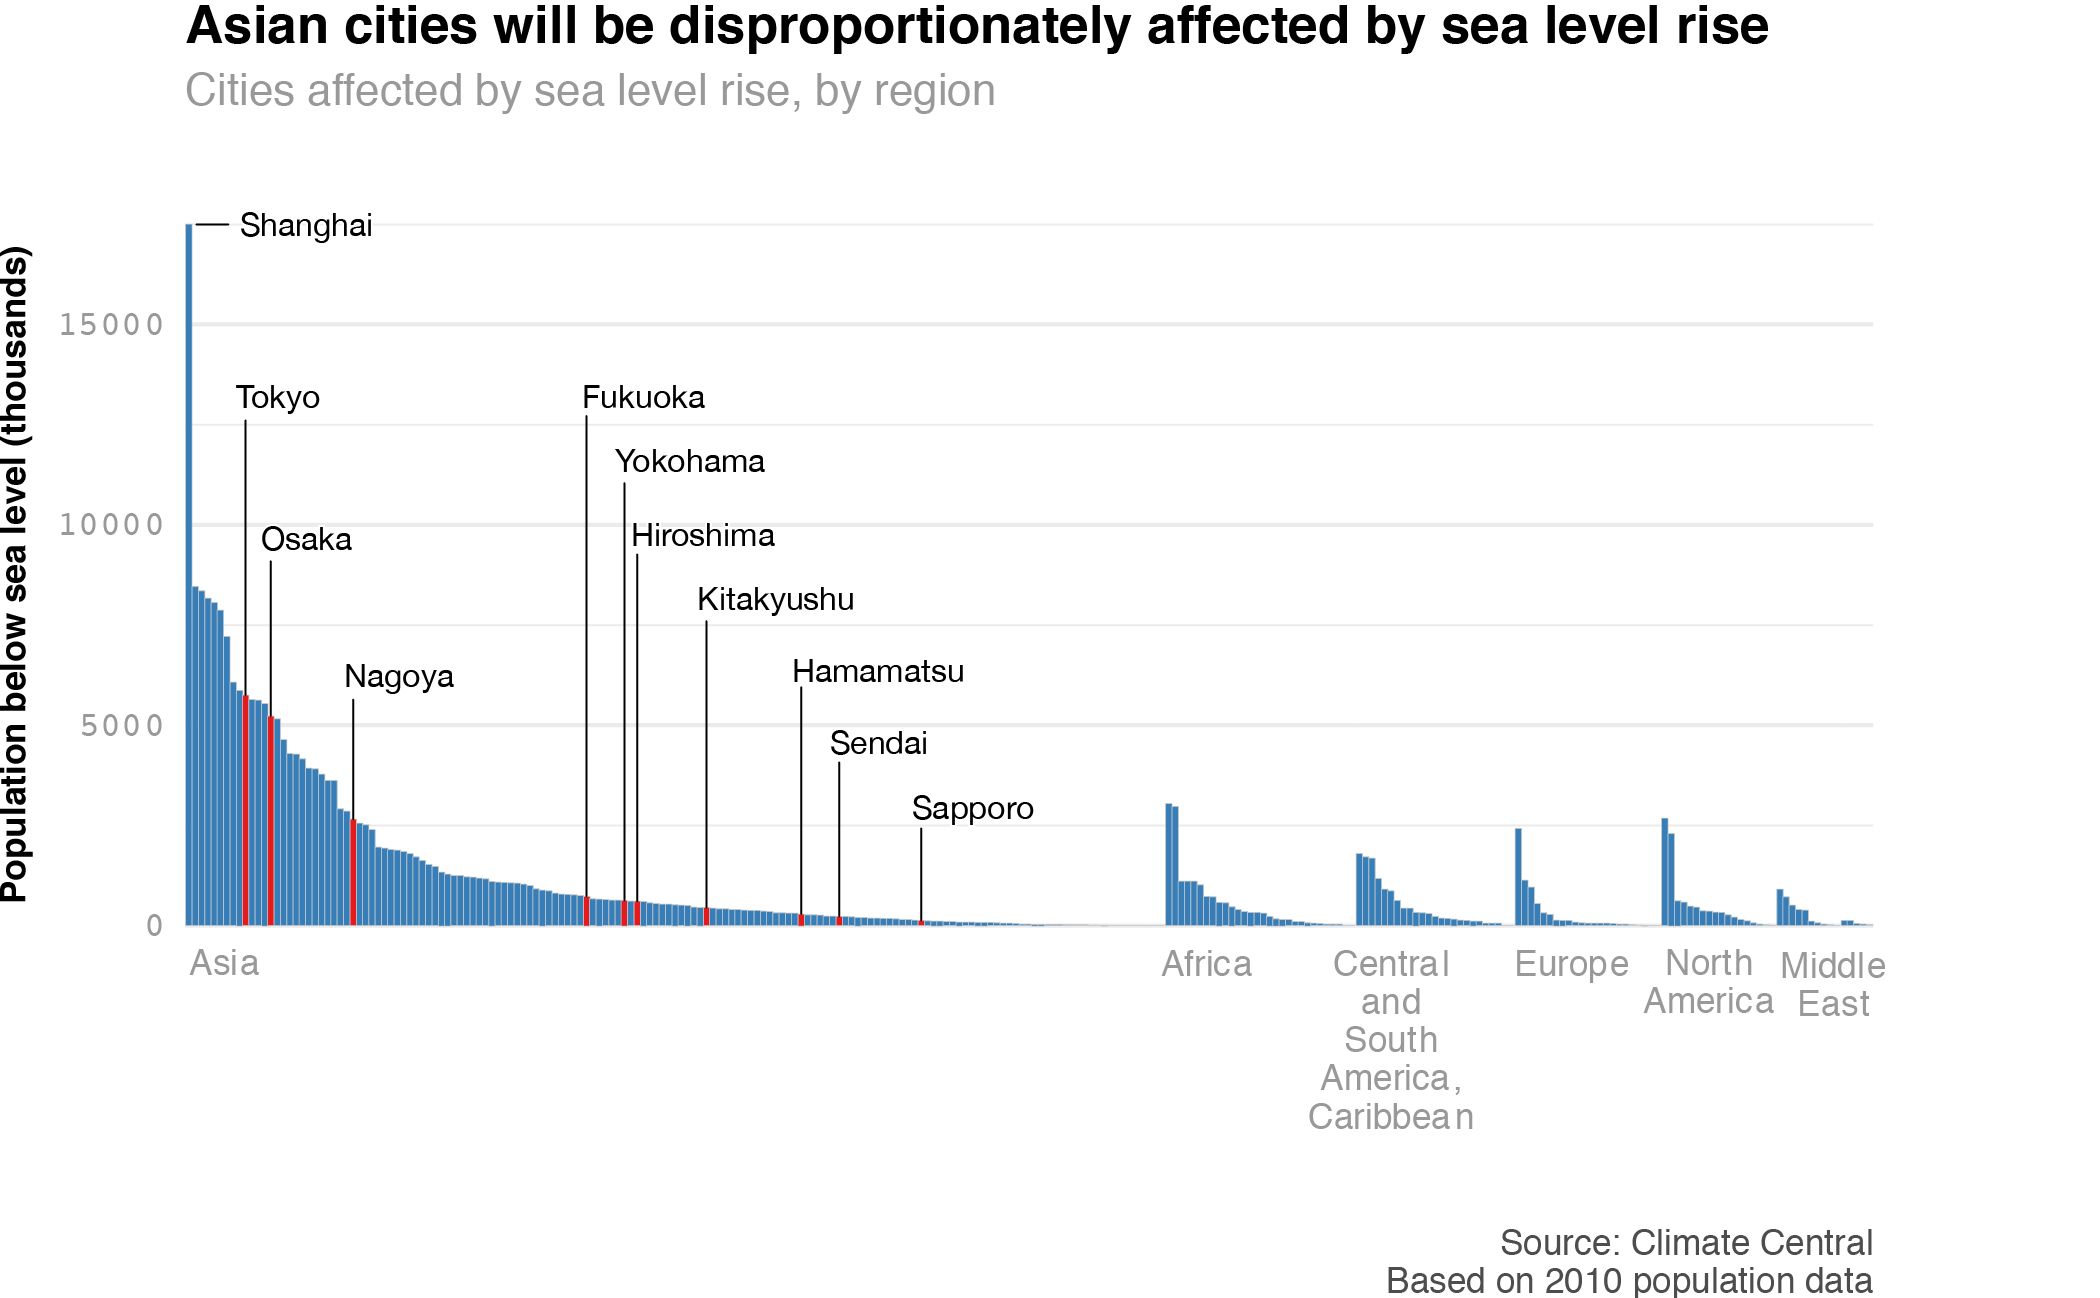
I think I bit off more than I could chew, and the project ended up taking much longer than I anticipated. Still, I’m proud that I could teach myself these skills during my breaks at work.
Throughout the project, I used a variety of tools, including HTML, CSS, Javascript, Leaflet.js, ggplot, and Illustrator.
Continue reading...